Given the inherently high-risk profile of mining and recognising that our people are our most valuable asset, ensuring employee safety is a key measure for our corporate success.
How We Measure Our Performance
OUR APPROACH TO HEALTH, SAFETY & WELL-BEING
Hochschild Safety 2.0
The second iteration of our multi-faceted plan to embed a safety-first culture across the Group.
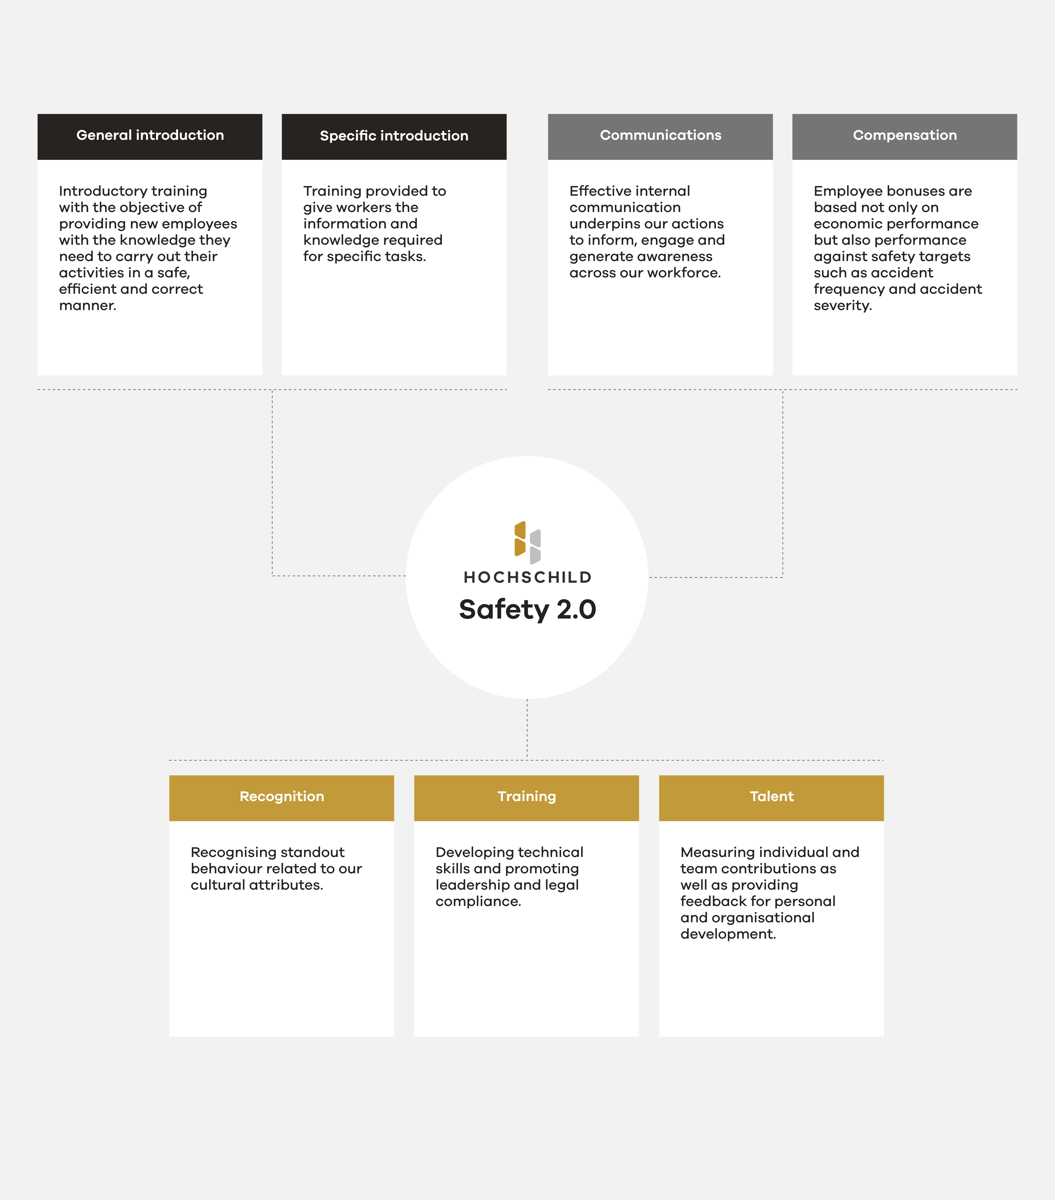
Health, safety and wellbeing focus areas
Systematically Managing Risks
Managing health and safety risks is at the centre of our approach to safety and is underpinned by our Occupational Health and Safety Management Systems. This management system follows best practice, in line with recognised international practices, and is externally certified to ensure compliance amongst mining units.
In 2022, we retained our DNV Level 7 Occupational Health and Safety Management System rating, reflecting our unwavering commitment to upholding the highest safety standards.
To ensure a safe working environment, we implement a systematic risk management approach, supported by our Occupational Health and Safety Management System.
Investigating and Learning
Since 2017, we have been monitoring the occurrence of High Potential Events (“HPEs”). HPEs are events which could have caused serious injury and encompass near misses as well as lost time events. Each time an HPE occurs, our CEO convenes a meeting with the Vice Presidents of Operations and Human Resources, the country managers as well as site managers and the corporate safety team. The site leader where the HPE occurred presents the investigation and the Committee feeds into the root cause analysis and proposed action plan. The lessons learnt are then conveyed by site managers at other operations to their respective units.
Health and Safety Indicators
| Indicator | 2022 | 2021 | 2020 | 2019 | 2018 | 2017 | 2016 | 2015 | 2014 | 2013 | 2012 |
|---|---|---|---|---|---|---|---|---|---|---|---|
| Fatal accidents | 0 | 2 | 1 | 0 | 3 | 4 | 0 | 0 | 0 | 2 | 4 |
| Accidents leading to an absence of one day or more | 29 | 22 | 19 | 20 | 35 | 55 | 47 | 42* | 76* | 49 | 81 |
| LTIFR1 | 1.37 | 1.26 | 1.38 | 1.05 | 1.74 | 2.69 | 2.2 | 1.85* | 3.07* | 2.08 | 3.33 |
| Accident Severity Index2 | 93 | 676 | 474 | 54 | 930 | 1,264 | 136 | 112 | 149 | 598 | 1,058 |
* Includes accidents and injuries reported by the Main Contractor and Subcontractors at the Inmaculada Project.
1 Calculated as total number of accidents per million labour hours.
2 Calculated as total number of days lost per million labour hours.
| Indicator | 2022 | 2021 | 2020 | 2019 | 2018 | 2017 | 2016 | 2015 | 2014 | 2013 | 2012 |
|---|---|---|---|---|---|---|---|---|---|---|---|
| Average number of medical attendances at Peruvian operations and at San José per month | 2,495 | 2,769 | 2,478 | 2,973 | 3,498 | 3,449 | 4,323 | 3,964 | 4,695 | 2,614 | 3,376 |
| Average number of work-related incidents requiring medical attention at Peruvian operations and at San José per month | 8 | 6 | 8 | 11 | 13 | 14 | 21 | 22 | 23 | 14 | 18 |
| Average number of occupational health examinations at the Group’s Peruvian operations | 213 | 121 | 112** | 553 | 487 | 433 | 367 | 283* | 507 | 475 | 441 |
* The number of occupational health examinations decreased due to the conclusion of construction of the Inmaculada project
**The Covid pandemic resulted in the implementation of emergency measures by the Peruvian Government which prevented health examinations from being carried out for most of the year